

Knowledge Bank
The B1 English Gap in UK Social Care, and How to Close It
Back to Menu ↩ The visa route that rebuilt the frontline care workforce set the English bar at B1. That route has now closed to
IELTS Academic Writing Task 1 requires you to write a report on a set of data in 150 words in 20 minutes.
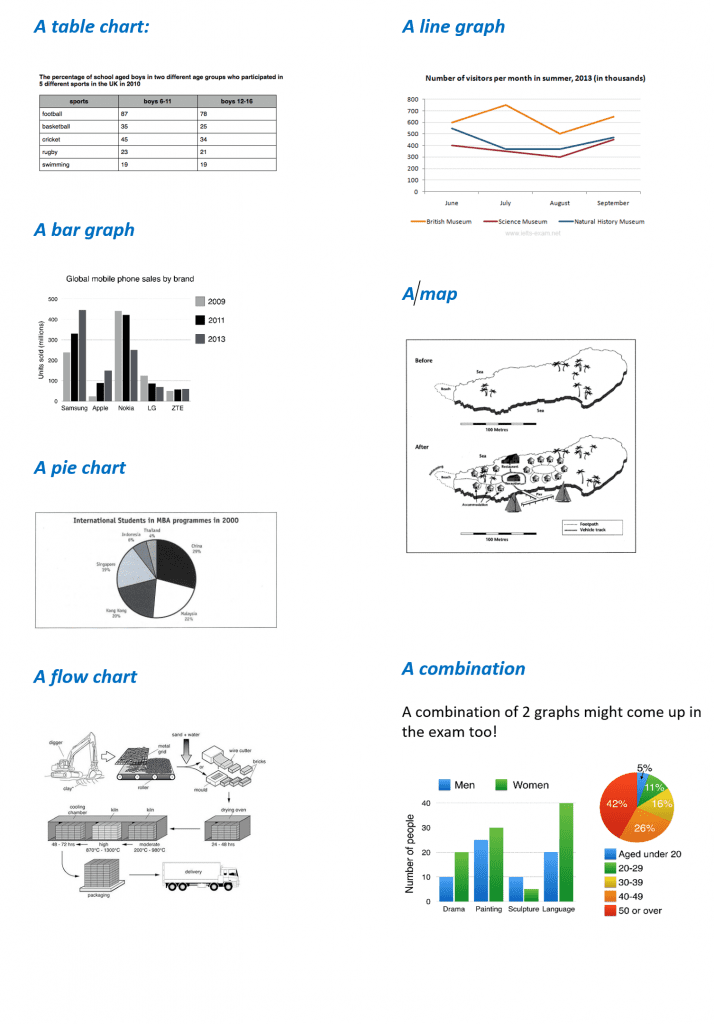
There are 6 different types of data graphs/charts/diagrams that can come up in the exam and these are shown below.
It is very important that you (a) read the instructions carefully to understand what is required and (b) fully answer the question. A typical Task 1 answer should have:
The introduction is usually very simple to write, as it should only explain what the chart/graph shows. To do this, the question should be paraphrased. This means it should be rewritten using your own words. 1 or 2 sentences is enough!
For example, if task description is: ‘The bar chart shows the number of overseas students enrolled in a Computer Science course at a Canadian college in 2010’.
A good way to paraphrase it would be: ‘The bar graph illustrates how many overseas students took a course in Computer Science at a specific school in Canada in a given year, 2010’.
Let’s have a look at another example:
Task description: The line graph shows the proportion of the population aged 65 and over between 1940 and 2040 in three different countries.
Introduction (paraphrase): The given line chart details the percentages of the elderly population in three different countries over 100 years, from 1940 to 2040.
The introduction should only take a maximum of 2-3 minutes to write!
The overview is a paragraph which contains the key points and features of the chart/graph. It is very important as it directly affects the criteria called Task Achievement. In fact, it will be impossible to get above band 5 in that criteria if there is no overview.
The overview statement can go at the beginning or the end of the report. It shows that you can identify the most important points from the graph. No numbers/percentages are needed, only the most significant features.
Below is an example.
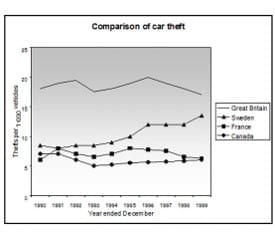
The line graph shows thefts per thousand vehicles in four countries between 1990 and 1999.
To show the key points, you should point out that in the given period,
So, in this case, a good overview could be:
Overall, it can be seen that car thefts were far higher in Great Britain than in the other three countries throughout the 1990s, but that Sweden is the only country that showed a rise in numbers of thefts over the time concerned.
Writing an overview should take 3 minutes maximum!
The main body is where all the details are described – numbers, dates, percentages, and comparisons.
It is important to have 2 paragraphs and to identify similarities as well as differences. To do this you should group data together where there are trends or patterns. It is important that you bear in mind the time period described in the graph as this will determine the correct tenses to be used.
Here is an example (using the same line chart as above) of how to start the first paragraph:
What can be seen from the graph is that car thefts in Sweden, France and Canada started at a similar level at the beginning of the decade, at around 6 to 8 incidences per 1,000 vehicles. However, whereas the trend in Sweden was generally upwards, numbers in France and Canada saw a steady decline. By 1992, car thefts in Sweden overtook those of France and Canada and then rose steadily to around 13 per 1,000 cars by 1999. In France and Canada, there was a slight increase from 1993, with France rising more quickly to 1995, at which point it dropped gradually to equal the rate for Canada by the end of the decade at around 6 vehicles.
The second paragraph could then talk about Britain, describing the key trends and comparing it briefly with the other countries.
You should spend around 10 minutes on writing the Main Body.
You should spend 20 minutes on Task 2 in the exam. It is important that you organise your time well, you need enough time to brainstorm, plan, write and check/edit your essay.
Here is an example of how to plan your time
| Brainstorm/Understand the question | 2 min |
| Plan | 1 min |
| Write | 15 min |
| Edit/Check | 2 mins |
IELTS Task 1 is graded on 4 criteria.
We are IELTS preparation specialists. Our uniquely effective course design and delivery offers an unparalleled range of Medical- and exam-focused courses and tests.
Our courses will enable you to achieve a high score in the IELTS Academic English test.
Specialist Language Courses (SLC) are experts in both IELTS and OET preparation. We work with thousands of candidates every year and specialise in working with healthcare professionals. Clients include many NHS Trusts and private healthcare groups in the UK.
Call or email SLC to talk about your OET and IELTS options.
Get updates and get the latest materials on Medical English, OET and IELTS
Back to Menu ↩ The visa route that rebuilt the frontline care workforce set the English bar at B1. That route has now closed to

Contact us Back to Menu ↩ In this article, Laura Wiggin, Curriculum Manager for ESOL, Skills and Community Interpreting at Hopwood Hall College, shares how the